Select your country
Prism free trial
Geneious free trial
SnapGene free trial
Select your country
Select your country
Geneious Prime2021-04-14T22:47:11+05:30
geneious biologics prime white logo

Comprehensive suite of molecular biology and
sequence analysis tools

bioinformatics software
TRY FOR FREE
Pricing

Unlock the value of your sequence data

Sequence Analysis and Genomics

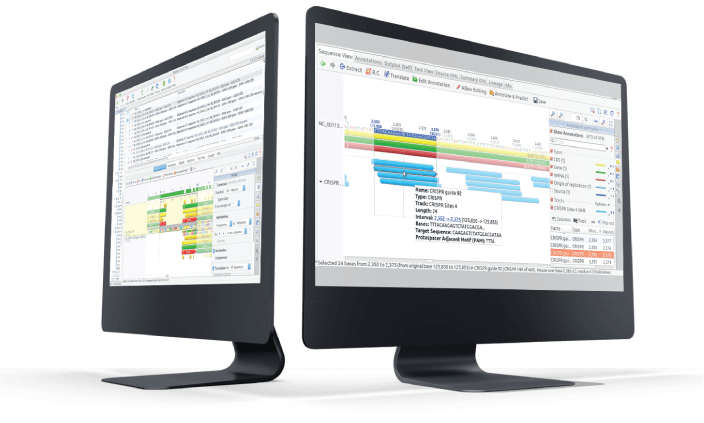
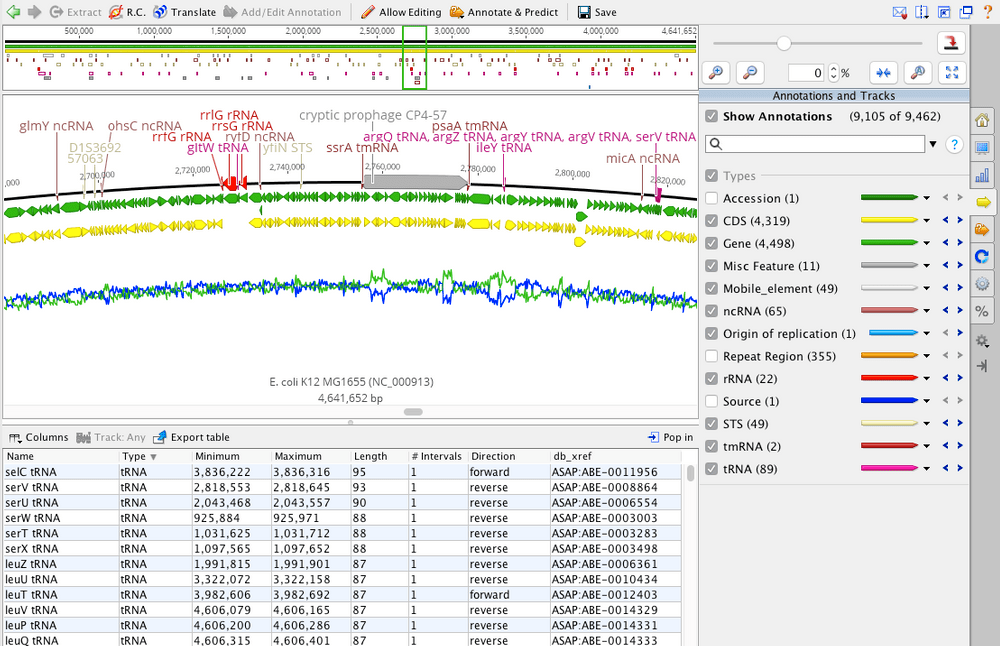
  • User-friendly, intuitive interface packed full of essential genomics tools for Sanger,  NGS and long read sequence analysis, including pairwise and multiple alignments, de novo assembly, mapping, expression analysis, variant calling, NGS visualization, sequence and chromatogram analysis, automatic annotation, and phylogenetic tree building.
Start a Free Trial
ngs visualize
Vector NTI

Molecular Biology

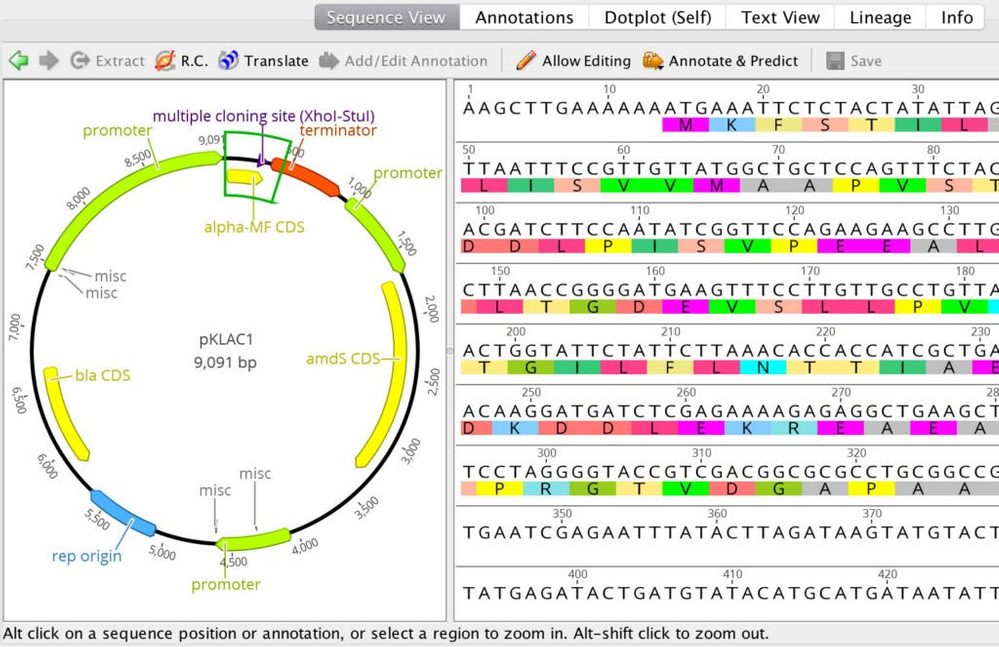
  • Perform a wide-range of cloning and primer design operations within one interface.  Automatically annotate plasmid maps and expression vectors. Simulate a variety of molecular cloning operations including restriction cloning, Gibson Assembly, Gateway cloning and TOPO cloning. Design and test primers, find CRISPR sites, and optimize codons.

Start a Free Trial

Data Management

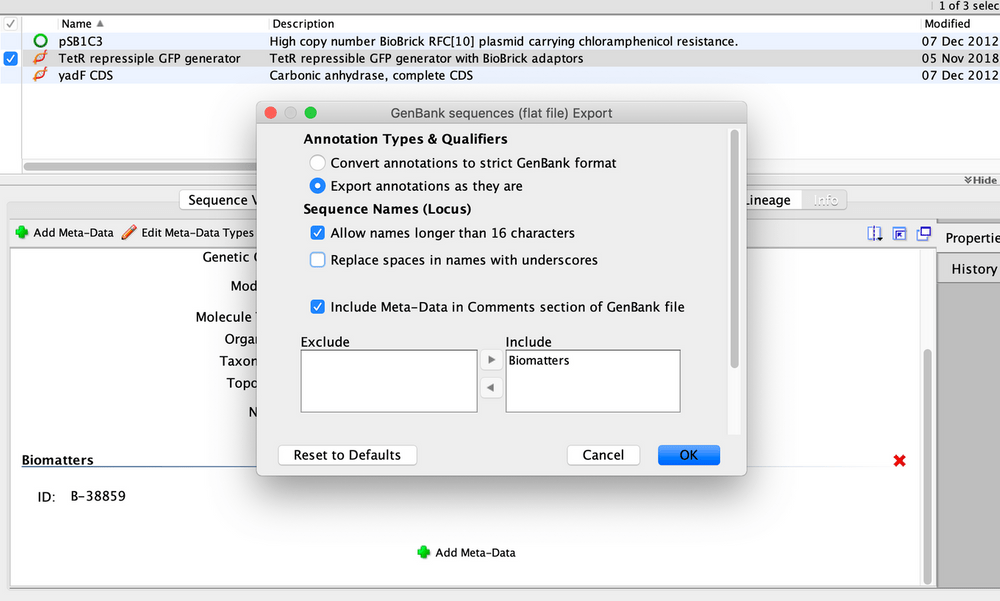
  • Simply drag and drop to import, export and convert your sequences, annotations and notes in common file formats including Genbank, SnapGene, FASTQ, FASTA, BAM, VCF, GFF, or import your complete Vector NTI database. Arrange and browse your data library how you like with document filtering, batch renaming, and document history automatically saved. Available for Mac, Windows and Linux.
Start a Free Trial
Improved GenBank Export option
Creating Workflows

Automate

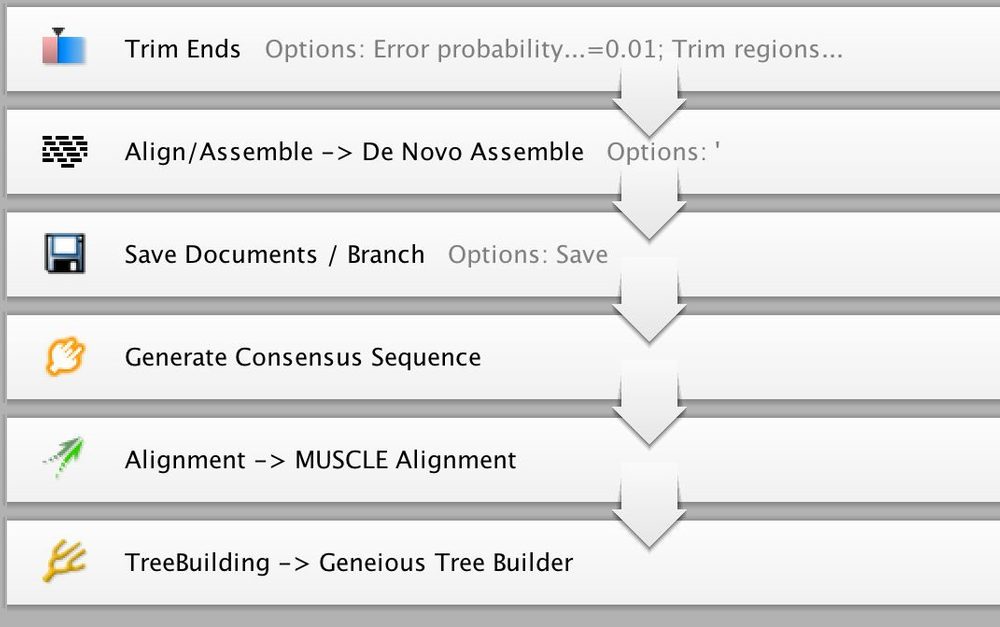
  • Create your own automated workflows or use in-built workflows to increase efficiency, control business processes, and reduce human error in your research. Connect directly to databases including UniProt, NCBI (Entrez), BLAST and PubMed. Databases searches can be automated, allowing you to continuously receive the latest information on genomes, sequences, and protein structures.

Start a Free Trial

Collaborate

  • Transform data management across teams, increase process efficiency and improve collaboration with intuitive folder-based organization and a seamlessly integrated shared database. Geneious Server Database is also available to purchase with a greater level of control and increased security for data access for your organization over the standard shared database.

Start a Free Trial
shared database
shared database

Customize

  • Extend the functionality of Geneious Prime with our collection of plugins available for assembly, alignment, phylogenetics and more. Integrate with existing systems and add your own custom algorithms using a highly interoperable API.

Start a Free Trial

Geneious Prime has you covered

NGS Pre-Processing2020-11-10T06:30:49+05:30

Import Illumina, PacBio and NanoPore reads

Trim, filter and demultiplex both single-end and paired-end data

Merge paired reads

De-duplicate

Error correct and normalize

Filter out chimeras

Mapping and de novo Assembly2020-11-10T06:34:49+05:30

Simply switch between industry leading algorithms for mapping and de novo assembly
Support for assembly of Sanger and NGS data, including Illumina, PacBio and Oxford Nanopore reads of any length, including paired-end reads and hybrid assemblies
Produce circular contigs when assembling microbial genomes, plasmids and other circular sequences
Genome comparison and finishing with MAUVE genome alignment
Mappers including Geneious, Geneious for RNA Seq, BBMap, Minimap2, Bowtie2 and TopHat
De novo assembly algorithms including Geneious, SPAdes, Flye, MIRA, Tadpole and Velvet

Variant Calling and Expression Analysis2020-11-10T06:38:14+05:30

Call SNPs/variants using Geneious or FreeBayes

Perform real-time filtering of tabular results with synchronized genome view
Calculate and compare expression levels on mapped RNA-seq data
Visualize using PCA and volcano plots

Sequence Analysis2020-11-10T06:40:17+05:30

Trim, assemble, and view Sanger sequencing trace files
Correct base calls and create consensus sequences

Annotate motifs, ORFs and repeats
Predict genes and structural elements
Real-time annotation via similarity search against database
Translate selections on the fly, or show translation for annotations or selected frame
Dynamic graphs and statistics for sequence properties such as pI, molecular weight, melting point, AA composition and more

Sequence Alignment2020-11-10T06:43:41+05:30

Multiple and pairwise sequence alignment of DNA or protein including full genome alignment
Align with trusted algorithms including Geneious Aligner, MUSCLE, MAFFT, Clustal Omega, MAUVE and LastZ
View and edit alignments with real-time translation and highlightingze using PCA and volcano plots

Phylogenetics2020-11-10T06:47:05+05:30

Build trees with Geneious tree builder, MrBayes, PAUP*, PhyML, RAxML and more
Visualize, edit and markup your trees
Interactive distance matrix viewer
Publication quality export

Microsatellite Analysis2020-11-10T06:48:02+05:30

Import raw ABI trace files
Trim, predict and manually adjust peaks
Bin peaks into alleles
Produce tabular output of allele calls

Primer Design2020-11-10T06:58:05+05:30

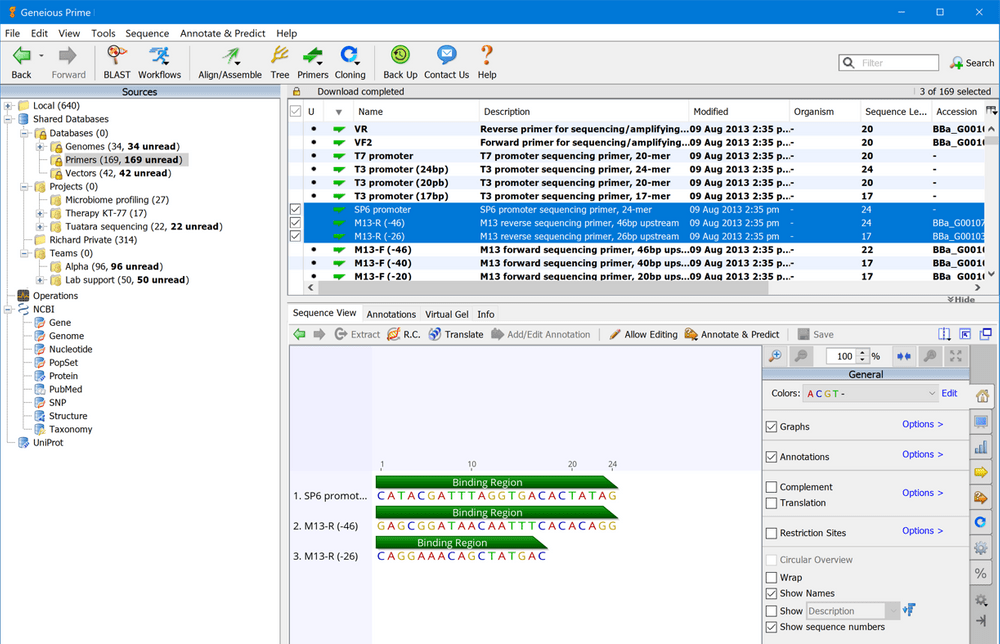
Automatically design PCR and sequencing primers and hybridization probes, to any target region or entire sequence
Easily add primers in the Sequence View
Design basic and degenerate PCR primers
Add and remove extensions to a primer sequence before, during or after the design process
Primer specificity testing to check for additional binding sites on the template sequence
Screen for physical properties, hairpins and primer-dimers
Drag and drop your primers in FASTA, spreadsheet or GenBank format

Molecular Cloning2020-11-10T06:52:12+05:30

Import raw ABI trace files
Trim, predict and manually adjust peaks
Bin peaks into alleles
Produce tabular output of allele calls

Data Management and Collaboration2020-11-10T07:00:07+05:30

Drag and drop import of files and folders, including Vector NTI databases
Import metadata from a spreadsheet onto sequences and other documents
Smart NGS import – one step import of any assortment of SAM, BAM, GFF, BED, and VCF files
Intuitive folder-based project organization
Seamlessly integrated shared database
Rapid search against all sequences and metadata in your database
Extensive export options

Searching and BLAST2020-11-10T07:02:28+05:30

Direct access to NCBI public BLAST databases
Custom BLAST for private local databases
Integrated search of external databases including GenBank and UniProt
Upload your sequences directly to GenBank
Search for literature in PubMed
Advanced searching against your local or shared database

Workflows2020-11-10T07:06:22+05:30

Create workflows for automated bulk analysis using a visual editor
More than 20 in-built workflows for performing
pipelines including Apply Variants to Reference Sequence, Map Reads then find SNPs, and Randomly Sample Sequences

Extend capabilities with option to write custom code workflows

API & Developers2020-11-10T07:22:47+05:30

Add specialized functionality or integrate with other systems using the Plugin Development Kit
Add your favorite algorithm, database or visualization
Wrap a command line program to run via the Geneious Prime GUI

Choosing a Statistical Test2021-12-01T05:15:17+05:30

Choose P value Format

Starting with Prism 8, Prism allows you to choose which decimal format Prism will use to report P values (information on previous versions of Prism can be found below). Each analysis that computes P values gives you four choices:

  • APA (American Psychological Association) style, which shows three digits but omits the leading zero (.123). P values less than 0.001 shown as “< .001”. All P values less than 0.001 are summarized with three asterisks, with no possibility of four asterisks.
  • NEJM (New England Journal of Medicine) style, which shows three digits and includes the leading zero (0.123). P values less than 0.001 shown as “< .001”. All P values less than 0.001 are summarized with three asterisks, with no possibility of four asterisks.
  • GraphPad style which reports four digits after the decimal point with a leading zero (0.1234). P values less than 0.0001 shown as “< .0001”. P values less than 0.001 are summarized with three asterisks, and P values less than 0.0001 are summarized with four asterisks.
  • Choose how many digits you want to see after the decimal point, up to 15. P values less than 0.001 are given three asterisks, and P values less than 0.0001 are given four asterisks.
    Symbol Meaning
    ns P > 0.05
    * P ≤ 0.05
    ** P ≤ 0.01
    *** P ≤ 0.001
    ****  P ≤ 0.0001 (For the last two choices only)

Note that the first two choices (APA and NEJM) show at most three asterisks (***) and the last two choices will show four asterisks with tiny P values (****).

The multiple t test analysis is different than all the rest. In earlier versions of the software (Prism 6), the “Significant?” column would display a single asterisk if the t test for that row is statistically significant, given your setting for alpha and the correction for multiple comparisons. Prism would either places a single asterisk in that column or leaves it blank. It would never places more than one asterisk. In this column, current versions of Prism simply write “Yes” or “No” depending on if the test corresponding to that row was found to be statistically significant or not.

Note a possible misunderstanding. Prism 8.0-8.2 presents the choices for P value formatting like this:

The P values shown are examples. It shows one P value presented as “.033”, or as “0.033”, or as “0.0332” depending on the choice you made (note the difference in the number of digits and presence or absence of a leading zero). Some people have misunderstood this to mean that we define a single asterisk to mean P<0.0332. But of course, we use the standard definition of <0.05. We’ll find a way to make these choices less confusing in a future release.

Will I get a certificate after completing GraphPad Prism & Biostatistics Training program?2024-09-10T17:07:10+05:30

Yes, the certificate of accomplishment will be provided after the successful completion of chosen Graphpad Prism & Biostatistics Training module on the registered email address.

Can I customize the contents of GraphPad Prism & Biostatistical Modules?2024-09-10T16:53:03+05:30

Yes, you can customize the course contents for GraphPad Prism & Biostatistics Training Modules. The Basic Training Module-An introduction to Biostatics will focus predominantly on theoretical concepts in Biostatistics principles and Biostatistical analysis and for our Professional Training Module-Getting things done with Graphpad Prism, you have the flexibility to send us the specific topics that you would like to incorporate into the professional training Module, we will then evaluate  your requested topics and check if we can accommodate them into the training module.

Which Graphpad Prism & Biostatistics Training Module is best suited for me?2024-09-10T17:01:48+05:30

Prism courses cater scientific researcher, students, health care, medical, pharma & biotech related field disciple equally. Whether you are seasoned Professional in biostatistics who wants to get the deeper understanding of Graphpad Prism software or a Beginner looking to build your core skill in Biostatistics and Biostatistical analysis, Prism Training courses got you covered.

If you are looking solidify your foundation in Biostatistics and get the theoretical comprehensive understanding of how to carry out various biostatical analysis like Normality, Outliers, Confidence Intervals, Statistical Hypothesis testing, P Value, t-Tests – Paired/Unpaired, Tests for contingency tables, ANOVA, Post Hoc tests, Correlation and Regression and so on the we recommend you to enrol in Basic training module -An introduction to Biostatistics 

However, if you possess standard knowledge on Biostatistical analysis and wishes to get familiarized with GraphPad prisms software interface, understand the intricacies of the prism software and learn data visualization or how to carry out various biostatistical tests( like Chi Square tests, Fisher’s exact test, t-tests, ANOVA, Correlation, Regression and so on) in GraphPad prism then we suggest you to enroll in our Professional training module-Getting things done with GraphPad prism.

Who can enroll in this GraphPad Prism course?2024-10-09T22:30:05+05:30

GraphPad Prism & Biostatistics Training modules are designed for individuals involved in scientific research, particularly those in the fields of Pharmaceutical, Biotech, biology, healthcare, and related discipline or anyone interested biostatistics, regardless of their professional background, who want to gain a deeper understanding of statistical analysis can enroll in our Academy courses.

How long does it take to complete the GraphPad Prism training course?2024-09-10T17:05:34+05:30

GraphPad Prism & Biostatistics Training program is organized in three different Modules (Basic Training Module- An introduction to Biostatistics, Professional Training Module-Getting Things Done with Graphpad Prism& Advance Training Module-Prism for Enzyme kinetics and Pharmacology) these Prism course span a duration of 2-hours.

Take the First Step

Discover how Geneious tools and services can help you simplify and empower sequencing research and analysis.

PRICING
Go to Top